Data Visualization

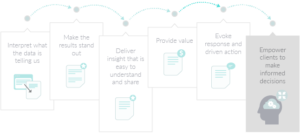
More Than DataWe Empower Clients to Make Informed Decisions
Research is more than data – it tells a story
Rather than giving you a stack of data, we provide a visually-compelling report that guides your decision-making. Visualizing data can dramatically reduce the time it takes to start making decisions, since showing the story of the research is much faster than locating, gathering, absorbing, and processing data in a spreadsheet. We believe data can be more than just spreadsheets or crosstabs, and we strive to show patterns, trends, and key findings.

